The network neutrality debate focuses primarily on supply side issues, such as whether content providers should be allowed to pay Internet service providers for “fast lanes”, and whether allowing them to do so would stifle innovation.

It seems fruitful to also look at network neutrality through a different lens. In this post I explore the following question:

What implications do network neutrality regulations have on equality of access to the Internet?

The Moral Dilemma

I’ve had a recurring debate with my friends who support network neutrality. Most of them agree with the following premises:

  • Society should strive to provide equal opportunities to all citizens.

  • Access to the Internet provides opportunities.

  • There are over a billion people in the world who cannot afford the costs of Internet data.1

  • Therefore, something should be done (immediately) to provide more affordable access to the Internet.

But when I try to take the argument further (as follows), the debate gets heated:

  • Some content providers (most notably: Facebook and the other members of the Free Basics program) are willing to pay Internet providers for the costs that consumers incur by accessing their content.2

  • Preventing these content providers from subsidizing Internet access (on network neutrality grounds3) prolongs inequalities in society.

Who Will Pay?

Although my net neutrality friends may agree that we should not prolong inequalities in society, they disagree that we should allow content providers to pay for data costs. According to them, the negative implications that might result outweigh the benefits of improved access.

But who else will pay?

One answer: the government. The government is (in most of the world4) a democratically elected body, accountable to the people. They could in theory implement an affordable Internet subsidy while maintaining network neutrality.

Personally, I’m skeptical that government-lead data subsidies will ever become widespread, particularly in countries where access inequalities are the most stark. Governments are slow to move, struggle to sustain projects that span multiple election cycles, and are not without their own conflicts of interest (e.g., consider that governments sell spectrum rights for billions of dollars,5 and may even seek to maintain high data costs as a form of censorship6)

Clearly this is a complex issue. In lieu of a solution to the moral dilemma, I’d like pursue another line of argumentation with my net neutrality friends:

The Definitional Dilemma

Before the World Wide Web (and still to this day!), phone calls were a very common way for people to access information. In the same way that billing works on the Internet, the consumer of voice information (the caller) needs to pay the phone provider for the costs of transporting their phone calls.

Some voice content providers (customer service centers, crime reporting centers, suicide help lines, etc.) decided that they would like to allow consumers of their services to call in for free. Instead of having the consumer pay, the content providers pay the phone provider for the costs of maintaining their toll-free phone line.

The parallels to the Internet are striking. Many of the arguments against Internet content providers also seem to apply to voice content providers. (What if a small innovative startup cannot afford to pay for a toll-free phone line? etc.).

Yet, toll-free phone lines aren’t bothersome to my net neutrality friends. I think it would be valuable for us to understand why!

I suspect that the content being served (and the companies that are doing the serving) is the real source of discomfort for people who oppose Free Basics. The same people don’t have much of an issue with toll-free phone lines because toll-free phone lines are commonly used by governments, non-profits and companies with ostensibly charitable intentions.

Yet there are plenty of governments, non-profits, and companies with charitable intentions who are eager to pay to deliver Internet content to consumers who can’t afford it. Which brings us to an actionable takeaway from this whole discussion:

Toll-Free Data via Voice Calls

Remember the good old days of dial-up modems? Dial-up modems transferred Internet data over voice lines, by encoding data as audio signals.

There’s no reason we can’t do the same over cellular to deliver data to a mobile phone. We just need software (a “modem”) running on the phone to decode the audio signals. In fact, this idea has already been proposed before, in a slightly different context.7

Now, if a well meaning company wants to provide data to consumers free of charge, they could pay for a toll-free phone line (or a return-your-missed-call phone line8) for consumers to call, and run a server that transfers data over that voice line whenever it receives a call. An application running on the phone could periodically make calls (without the user needing to intervene) to the toll-free phone number to retrieve small amounts of data.

What’s neat about this scheme is that we can implement it right now, without needing to change business models or wait on regulatory decisions. And it’s not fundamentally any different than toll-free phone lines, or even a regular return-your-missed-call phone system.9

Anyone have spare cycles to build the modem and server infrastructure? I’ve already got some ideas for great applications we could build on top of toll-free data.


Thanks to Bill Thies, Aurojit Panda, and Sachin Gaur for helping me shape these thoughts.


  1. Internet.org State of Connectivity Report 

  2. In fact there are two startups, Jana and Movivo, who are in the business of making it easy for content providers to reimburse consumers for the costs of their data usage, by sending mobile top-ups to the consumer after they have consumed the data. In India, Airtel rolled out a business model that allowed content providers to pay for data, but this has come under substantial criticism from network neutrality advocates. 

  3. As in the ban of Free Basics within India

  4. Historical data on the fraction of the world population living in democratic countries. 

  5. India ends spectrum auction for 9.5 billion dollars 

  6. As in Jordan or Eritrea. 

  7. Hermes: Data Transmission over Unknown Voice Channels

  8. With the (sole?) exception of the USA, phone calls are billed only to the caller, not the receiver. By giving a missed call (for free), the client can signal to the server to call them back, such that the server bears the cost of the phone call rather than the client. 

  9. Which does not require a toll-free number, you can run it over a normal phone number. 

In my job interviews earlier this year I had the opportunity to speak with many interesting people. I posed the following question to several of my interviewers:

Do technological innovations [that computer scientists produce] benefit society as a whole, or do they primarily improve the livelihood of people and institutions who are already well off?

Strikingly, I received a nearly identical response from three people I spoke to. Their response was something along the lines of the following:

“The innovations from computer science (are one of the few types of innovation that) trickle down”

In this blog post I seek to evaluate their claim.

Scoping the hypothesis

The question I posed was admittedly vague. What exactly did I mean by ‘benefit’, and how can we possibly make a statement about all technological innovations?

To scope the discussion, let’s focus on a more specific question:

Does progress in information technology correlate with an improvement in poverty rates?

We’d like to know, at a macroscopic level, whether IT helps people get out of poverty. Causation is difficult to argue, but if there is causation we should expect there to also be correlation.1

Data from the United States

In the following figure, Kentaro Toyama examines the data for the United States, using the federal government’s definition of poverty:

US Poverty Data

As we see, poverty rates in the USA haven’t budged since the early 1970s, and the absolute number of people living in poverty has actually gone up. This is despite huge advances in the proliferation of information technologies like the Internet, the world wide web, and smartphones.

From this, we can reasonably conclude that information technology alone has not had much of an effect on poverty numbers in the USA; there must be some other factors preventing such a large number of people from getting out of poverty.

Data from the World

The USA is just one country, and it is an anomalous country in many ways. Perhaps information technology does more to help the impoverished in the rest of the world? The remarkable chart below uses the World Bank’s definition2 for extreme poverty at $1.25 per day adjusted to purchasing power parity:

Worldwide Poverty Data

According to one reading, this data does not provide reason to doubt our trickle down hypothesis: there is a downward trend in the absolute number of people living in extreme poverty, which may be partially due to the proliferation of information technologies.

A less optimistic reading is that the decline in poverty numbers we see starting in the 1970s (well before the popularity of the Web) can largely be attributed to changes in the Chinese government’s polices, and, more recently, India’s own reforms starting in 1991.3 It seems entirely feasible that information technology played a negligible role in these transformations.

I’m not personally convinced that the innovations we (systems researchers) produce, which are often targeted towards the more privileged members of society, currently play a significant role in the socioeconomic well-being of the poor.

Caveats, caveats, caveats

My conclusion certainly does not imply that computer scientists should stop focusing on innovations targeted at the more privileged members of society. It’s very difficult to predict what kinds of impact our innovations will have; for example, the Apple engineers who developed the iPhone were explicitly targeting the rich, yet the popularity of the iPhone sparked a drive towards cellular data networks which are now the dominant mode of Internet in the developing world.

It’s also undeniably true that information technology positively touches the lives of the poor, even if the jury is still out on whether it can play a significant role in helping large numbers of them develop their socioeconomic well-being.

Personally, I’ve decided to pivot my direction away from high tech. I’m devoting the next year or two to understanding what role IT can play in the lives of the less privileged. We’ll see what I learn!


  1. Strictly speaking, neither correlation nor lack thereof prove anything about causation. But most scientists probably think Hume was just being pedantic. 

  2. The World Bank announced plans to move their definition of extreme poverty to $1.90 per day to recognize higher price levels in developing countries than previously estimated. 

  3. See Chapter 2 and 6 of Angus Deaton’s “The Great Escape” for an in-depth analysis of this data. 

Last month, Crista Lopes asked the twitterverse:

She compiled the answers she received in a blog post, which ended on a dispirited note:

In spite of unit testing being a standard practice everywhere, things don’t seem to have gotten any better for testing distributed systems end-to-end.

From my viewpoint atop the ivory tower, the state-of-the-art in testing distributed systems doesn’t seem quite as disappointing as Crista’s blog post might lead you to believe. As I am now wrapping up my dissertation on testing and debugging distributed systems, I feel compelled to share some of what I’ve learned about testing over the last five years.

Crista points out that there are several existing surveys of testing techniques for distributed systems, e.g. Inés Sombra’s RICON 2014 talk or Caitie McCaffrey’s CACM article. Here, I’ll structure the discussion around the challenges posed by different testing goals, and the tradeoffs different testing technologies make in overcoming those challenges. I’ll mostly cover end-to-end techniques (per Crista’s original question), and I’ll focus on academic research rather than best practices.

Here we go!

Regression Testing for Correctness Bugs

Crista’s original question is about regression testing, so I’ll start there. The regression testing problem for correctness bugs is the following:

  • We’re given: (i) a safety condition (assertion) that the system has violated in the past, and (ii) the environmental conditions (e.g. system configuration) that caused the system to violate the safety condition.
  • Our goal: we want to produce an oracle (automated test case) that will notify us whenever the old bug resurfaces as we make new changes to the codebase.

What’s hard about producing these oracles for distributed systems? A few challenges:

  • a) Non-determinism: we’d like our regression test to reliably reproduce the bug whenever it resurfaces. Yet distributed systems depend on two major sources of non-determinism: the order of messages delivered by the network, and clocks (e.g., failure detectors need timeouts to know when to send heartbeat messages1).
  • b) Timeliness: we’d like our regression test to complete within a reasonable amount of time. Yet if we implement it naïvely, the regression test will have to sleep() for a long time to ensure that all events have completed.

One way to overcome both a) and b) is to interpose on message and timer APIs. The basic idea here is to first record the behavior of the non-deterministic components of the system (e.g., track the order of messages delivered by the network) leading up to the original bug. Then, when we execute the regression test, we guide the behavior of those non-deterministic components to stay as close as possible to the original recorded execution.2

Interposition helps us produce reliable results, and it allows us to know exactly when the test has completed so that we don’t need to sleep() for arbitrary amounts of time. In some cases we can even run our regression tests significantly faster than they would actually take in production, by delivering timer events before the true wall-clock time for those timers has elapsed (without the system being aware of this fact).3

However, interposition brings two additional challenges:

  • c) Engineering effort: depending on where we choose to interpose, we might need to expend large amounts of effort to ensure that our executions are sufficiently deterministic.
  • d) Limited shelf-life: if we record interposition events at fine granularity, the regression test is likely to break as soon as we make small changes to the system (since the API calls invoked by the system will differ). Ideally we would like our regression tests to remain valid even as we make substantial changes to the system under test.

Solutions

On one extreme, we could use deterministic replay tools to reliably execute our regression test. These tools interpose on syscalls, signals, and certain non-deterministic instructions.4 If your distributed system has a small enough memory footprint, you can just execute deterministic replay with all of your nodes on a single physical machine.5,6 There are also approaches for replaying across multiple machines.7,8

Deterministic replay assumes that you are able to record an execution that leads up to the bug. To replay that execution, these tools wait for the application to make the same sequence of syscalls as the original execution, and return the same syscall values that were originally returned by the OS. Since the application must go through the syscall layer to interact with the outside world (including, for example, to read the current time), we are guaranteed determinism. That said, one major issue with using deterministic replay for regression testing is that the execution recording has limited shelf-life (since syscall recordings are very fine-grained).

Another issue with deterministic replay is that you don’t always have a recorded execution for bugs that you know exist. If you’re willing to wait long enough, it is possible to synthesize an interleaving of messages / threads that leads up to the known bug.9,10,11,12,13

Another point in the design space is application-specific interposition, where we interpose on a narrow, high level API such as the RPC layer. We aren’t guaranteed determinism here, but we can achieve decent reliability with a judicious choice of interposition locations.

One major advantage of application-specific interposition is reduced recording overhead: since we’re interposing on a high level API, we might be able to turn on execution recording in production to avoid needing to reproduce bugs in a test environment. Another advantage is extended shelf-life: we’re interposing on coarse, high level events, and we also have access to application semantics that help us recognize extraneous changes to the application’s behavior (e.g., we can know that cookies or sequence numbers should be ignored when deciding whether a message from the recorded execution is logically equivalent to a message in a replay execution).

[Shameless plug for my own work, which fits into the category of application-specific interposition: our DEMi tool14 allows you to produce regression tests without having to write any code. First, you use it find correctness bugs through randomized concurrency testing. You can then minimize the buggy execution, and finally you can replay the execution as a regression test. DEMi interposes on timers to make the execution super fast, and allows you to specify message fields that should be ignored to help increase the shelf-life of the recording.]

Finally, on the other extreme of the design space, we can just replay multiple times without any interposition and hope that the bug-triggering event interleaving shows up at least once.15 This requires minimal engineering effort and has unbounded shelf-life, but it may be unable to consistently reproduce the buggy execution.

Regression Testing for Performance (Latency) Bugs

The regression testing problem for latency bugs is similar to above, with a few differences:

  • We’re given: (i) an assertion that we know the system has violated in the past, usually statistical in nature, about how long requests should take to be processed by the system, and (ii) a description of the system’s workload at the time the latency problem was detected.
  • Our goal: we want to produce an oracle that will notify us whenever request latency gets notably worse as we make new changes to the system.

A few challenges:

  • a) Flakiness: Performance characteristics typically exhibit large variance. Despite variance, we need our assertion to avoid reporting too many false positives. Conversely, we need to prevent the assertion from missing too many true positives.
  • b) Workload characterization: it can be difficult to reproduce production traffic mixes in a test environment.

Regardless of whether your system is distributed or located on a single machine, request latency is defined by the time it takes to execute the program’s control flow for that request. In a system where concurrent tasks process a single request, it is useful to consider the critical path: the longest chain of dependent tasks starting with the request’s arrival, and ending with completion of the control flow.

The challenges with observing control flow for distributed systems are the following:

  • c) Limited Visibility: the control flow for a single request can touch thousands of machines, any one of which might be the source of a latency problem.16 So, we need to aggregate timing information across machines. Simple aggregation of statistics often isn’t sufficient though, since a single machine doesn’t have a way of knowing which local tasks were triggered by which incoming request.
  • d) Instrumentation Overhead: It’s possible that the act of measuring execution times can itself significantly perturb the execution time, leading to false positives or false negatives.
  • e) Intrusiveness: if we’re using our production deployment to find performance problems, we need to avoid increasing latency too much for clients.

Solutions

The main technique for addressing these challenges is distributed tracing. The core idea is simple:17 have the first machine assign an ID to the incoming request, and attach that ID (plus a pointer to the parent task) to all messages that are generated in response to the incoming request. Then have each downstream task that is involved in processing those messages log timing information associated with the request ID to disk.

Propagating the ID across all machines results in a tree of timing information, where each vertex contains timing information for a single task (the ingress being the root), and each edge represents a control flow dependency between tasks. This timing information can be retrieved asynchronously from each machine. To minimize instrumentation overhead and intrusiveness, we can sample: only attach an ID to a fraction of incoming requests. As long as overhead is low enough, we could overcome the challenge of workload characterization by running causal tracing on our production deployment.

Here is an illustration18:

Trace Example

What can we do with causal trees? A bunch of cool stuff: characterize the production workload so that we can reproduce it in a test environment,19 resource accounting20 and ‘what-if’ predictions for resource planning,21 track flows across administrative domains,22 visualize traces and express expectations about how flows should or should not be structured,23 monitor performance isolation in a multi-tenant environment,24 and most relevant for performance regression testing: detecting and diagnosing performance anomalies.25

Distributed tracing does require a fair amount of engineering effort: we need to modify our system to attach and propagate IDs (it’s unfortunately non-trivial to ‘bolt-on’ a tracing system like Zipkin). Perhaps the simplest form of performance regression testing we can do is to analyze performance statistics without correlating across machines. We can still get end-to-end latency numbers by instrumenting clients, or by ensuring that the machine processing the incoming request is the same as the machine sending an acknowledgment to the client. The key issue then is figuring out the source of latency once we have detected a problem.

Discovering Problems in Production

Despite our best efforts, bugs invariably make it into production.26 Still, we’d prefer to discover and diagnose these issues through means that are more proactive than user complaints. What are the challenges of detecting problems in production?:

  • a) Runtime overhead: It’s crucial that our instrumentation doesn’t incur noticeable latency costs for users.
  • b) Possible privacy concerns: In some cases, our monitoring data will contain sensitive user information.
  • c) Limited visibility: We can’t just stop the world to collect our monitoring data, and no single machine has global visibility into the state of the overall system.
  • d) Failures in the monitoring system: The monitoring system is itself a distributed system that needs to deal with faults gracefully.

Solutions

An old idea is particularly useful here: distributed snapshots.27 Distributed snapshots are defined by consistent cuts: a subset of the events in the system’s execution such if any event e is contained in the subset, all ‘happens-before’ predecessors of e are also contained in the subset.

Distributed snapshots allow us to obtain a global view of the state of all machines in the system, without needing to stop the world. Once we have a distributed snapshot in hand, we can check assertions about the state of the overall system (either offline28 or online29).

Since runtime overheads limit how much information we can record in production, it can be challenging to diagnose a problem once we have detected it. Probabilistic diagnosis techniques30,31,32 seek to capture carefully selected diagnostic information (e.g. stack traces, thread & message interleavings) that should have high probability of helping us find the root cause of a problem. One key insight underlying these techniques is cooperative debugging: the realization that even if we don’t collect enough diagnostic information from a single bug report, it’s quite likely that the bug will happen more than once.33

Identifying which pieces of hardware in your system have failed (or are exhibiting flaky behavior) is a non-trivial task when you only have a partial view into the state of the overall system. Root cause analysis techniques (a frustratingly generic name IMHO..) seek to infer unknown failure events from limited monitoring data.34,35

That’s It For Now; More to Come!

I should probably get back to writing my dissertation. But stay tuned for future posts, where I hope to cover topics such as:

  • Fault tolerance testing
  • Test case reduction
  • Distributed debugging
  • Tools to help you write correctness conditions
  • Tools to help you better comprehend diagnostic information
  • Dynamic analysis for finding race conditions & atomicity violations
  • Model checking & symbolic execution
  • Configuration testing
  • Verification
  • Liveness issues

If you’d like to add anything I missed or correct topics I’ve mischaracterized, please feel free to issue a pull request!


  1. “Heartbeat: A Timeout-Free Failure Detector for Quiescent Reliable Communication.” International Workshop on Distributed Algorithms ‘97 

  2. The test framework can’t modify the messages sent by the system, but it can control other sources of non-determinism, e.g. the order in which messages are delivered. 

  3. “To Infinity and Beyond: Time-Warped Network Emulation”, NSDI ‘06 

  4. “Hardware and software approaches for deterministic multi-processor replay of concurrent programs”, Intel Technology Journal ‘09 

  5. “ReVirt: Enabling Intrusion Analysis Through Virtual-Machine Logging and Replay”, OSDI ‘02 

  6. “Deterministic Process Groups in dOS, OSDI ‘10”. [Technically deterministic execution, not deterministic replay] 

  7. “Replay Debugging For Distributed Applications”, ATC ‘06 

  8. “DDOS: Taming nondeterminism in distributed systems”, ASPLOS ‘13. 

  9. “Execution Synthesis: A Technique For Automated Software Debugging”, EuroSys ‘10 

  10. “PRES: Probabilistic Replay with Execution Sketching on Multiprocessors”, SOSP ‘09 

  11. “ODR: Output-Deterministic Replay for Multicore Debugging”, SOSP ‘09 

  12. “Analyzing Multicore Dumps to Facilitate Concurrency Bug Reproduction”, ASPLOS ‘10 

  13. “Debug Determinism: The Sweet Spot for Replay-Based Debugging”, HotOS ‘11 

  14. “Minimizing Faulty Executions of Distributed Systems”, NSDI ‘16 

  15. “Testing a Database for Race Conditions with QuickCheck”, Erlang ‘11 

  16. We might not need to aggregrate statistics from all the machines, but at the very least we need timings from the first machine to process the request and the last machine to process the request. 

  17. “Path-based failure and evolution management”, SOSP ‘04 

  18. “So, you want to trace your distributed system? Key design insights from years of practical experience”, CMU Tech Report 

  19. “Using Magpie for request extraction and workload modelling”, SOSP ‘04 

  20. “Stardust: tracking activity in a distributed storage system”, SIGMETRICS ‘06 

  21. “Ironmodel: robust performance models in the wild”, SIGMETRICS ‘08 

  22. “X-trace: a pervasive network tracing framework”, NSDI ‘07 

  23. “Pip: Detecting the Unexpected in Distributed Systems”, NSDI ‘06 

  24. “Retro: Targeted Resource Management in Multi-tenant Distributed Systems”, NSDI ‘15 

  25. “Diagnosing performance changes by comparing request flows”, NSDI ‘11 

  26. ‘Hark’, you say! ‘Verification will make bugs a thing of the past!’ –I’m not entirely convinced… 

  27. Distributed Snapshots: Determining Global States of Distributed Systems, ACM TOCS ‘85 

  28. WiDS Checker: Combating Bugs in Distributed Systems, NSDI ‘07 

  29. D3S: Debugging Deployed Distributed Systems, NSDI ‘08 

  30. SherLog: Error Diagnosis by Connecting Clues from Run-time Logs, ASPLOS ‘10 

  31. Effective Fault Localization Techniques for Concurrent Software, PhD Thesis 

  32. Failure Sketching: A Technique for Automated Root Cause Diagnosis of In-Production Failures, SOSP ‘15 

  33. Cooperative Bug Isolation, PhD Thesis 

  34. A Survey of Fault Localization Techniques in Computer Networks, SCP ‘05 

  35. Detailed Diagnosis in Enterprise Networks, SIGCOMM ‘09 

Research on distributed systems is often motivated by some variation of the following:

Developers of distributed systems face notoriously difficult challenges, such as concurrency, asynchrony, and partial failure.

That statement seems convincing enough, but it’s rather abstract. In this post we’ll gain a concrete understanding of what makes distribution so challenging, by describing correctness bugs we found in an implementation of the Raft consensus protocol.

Raft is an interesting example because its authors designed it to be understandable and straightforward to implement. As we’ll see, implementing even the relatively straightforward Raft spec correctly requires developers to deal with many difficult-to-anticipate issues.

Fuzz testing setup

To find bugs we’re going to employ fuzz testing. Fuzz tests are nice because they help us exercise situations that developers don’t anticipate with unit or integration tests. In a distributed environment, semi-automated testing techniques such as fuzzing are especially useful, since the number of possible event orderings a system might encounter grows exponentially with the number of events (e.g. failures, message deliveries)–far too many cases for developers to reasonably cover with hand-written tests.

Fuzz testing generally requires two ingredients:

  1. Assertions to check.
  2. A specification of what inputs the fuzzer should inject into the system.

Assertions

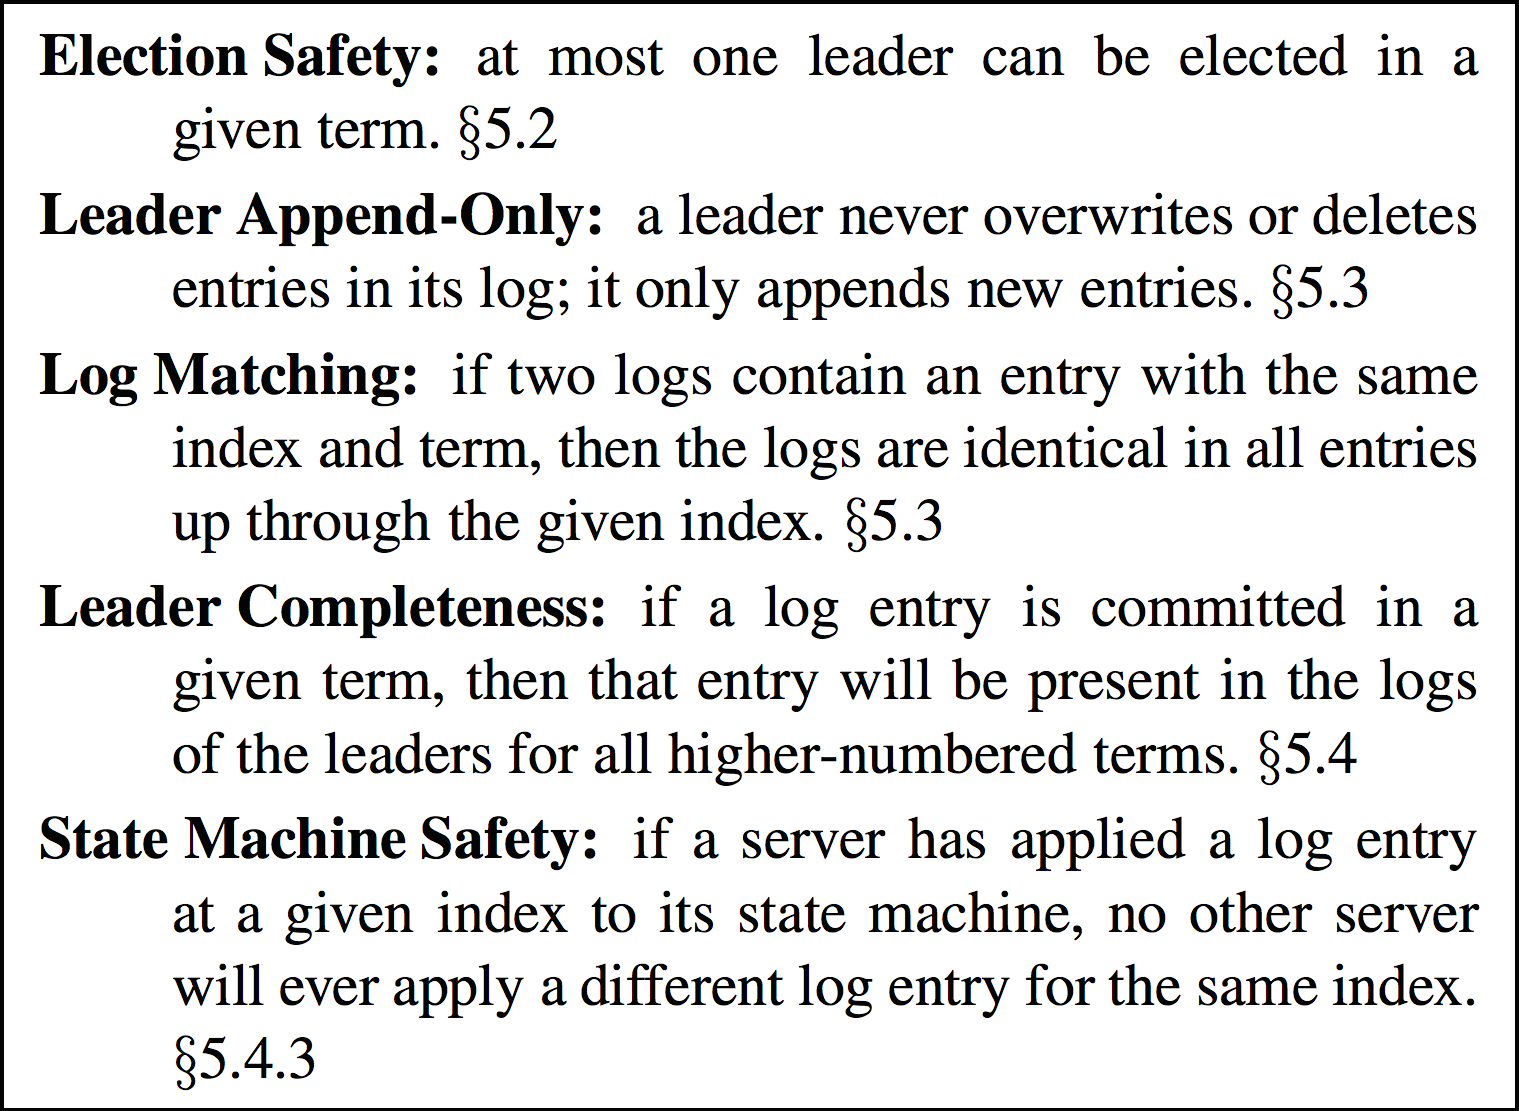
The Raft protocol already has a set of nicely defined safety conditions, which we’ll use as our assertions.

Raft Invariants

Figure 3 from the Raft paper (copied left) shows Raft's key invariants. We use these invariants as our assertions. Each assertion should hold at any point in Raft's execution.

For good measure, we also add in one additional assertion: no Raft process should crash due to an uncaught exception.

We'll check these invariants by periodically halting the fuzz test and inspecting the internal state of each Raft process. If any of the assertions ever fails, we've found a bug.


Input generation

The trickier part is specifying what inputs the fuzzer should inject. Generally speaking, inputs are anything processed by the system, yet created outside the control of the system. In the case of distributed systems there are a few sources of inputs:

  • The network determines when messages are delivered.
  • Hardware may fail, and processes may (re)join the system at random points.
  • Processes outside the system (e.g. clients) may send messages to processes within the system.

To generate the last two types of inputs, we specify a function for creating random external messages (in the case of Raft: client commands) as well as probabilities for how often each event type (external message sends, failures, recoveries) should be injected.

We gain control over the network by interposing on the distributed system’s RPC layer, using AspectJ. For now, we target a specific RPC system: Akka. Akka is ideal because it provides a narrow, general API that operates at a high level abstraction based around the actor model.

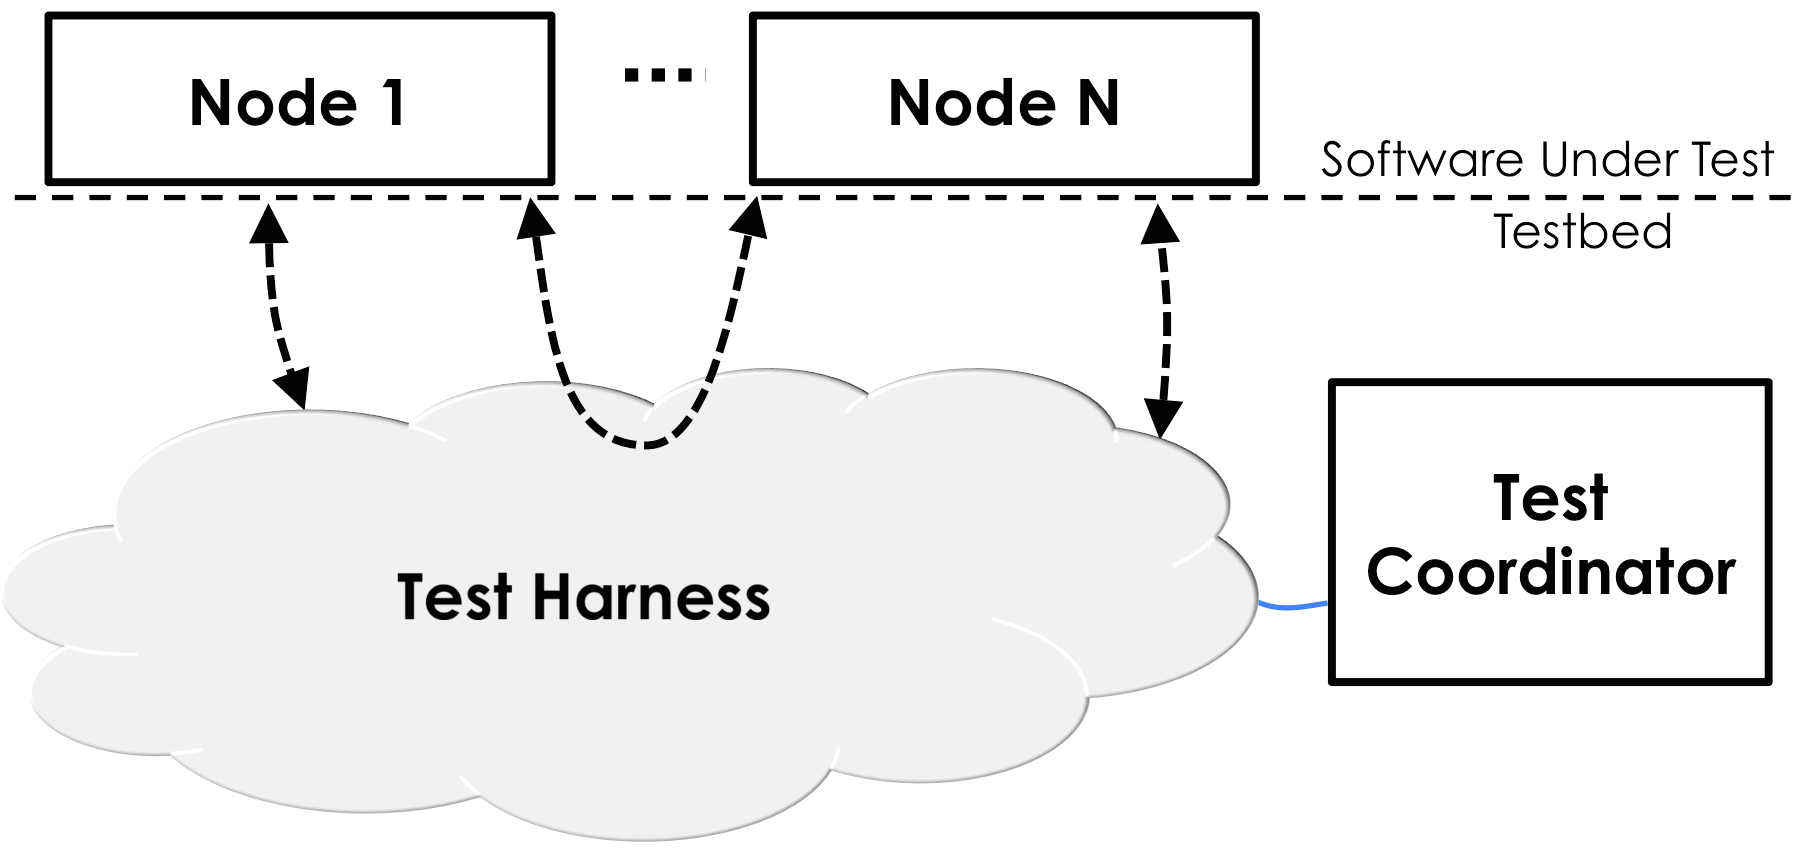
Our interposition essentially allows us to play god: we get to choose exactly when each RPC message sent by the distributed system is delivered. We can delay, reorder, or drop any message the distributed system tries to send. The basic architecture of our test harness (which we call DEMi) is shown below:

Every time a process sends an RPC message, the Test Harness intercepts it and places it into a buffer. The Test Coordinator later decides when to deliver that message to the recipient. In a fully asynchronous network, the Test Coordinator can arbitrarily delay and reorder messages.

The Test Coordinator also injects external events (external message sends, failures, recoveries) at random according to the probability weights given by the fuzz test specification.

Test Harness

Interposing at the RPC layer has a few advantages over interposing at a lower layer (e.g. the network layer, a la Jepsen). Most importantly, we get fine-grained control over when each individual (non-segmented) message is delivered. In contrast, iptables is a much more blunt tool: it only allow the tester to drop or delay all packets between a given pair of processes [1].

Targeting applications built on Akka gives us one other advantage: Akka provides a timer API that obviates the need for application developers to read directly from the system clock. Timers are a crucial part of distributed systems, since they are used to detect failures. In Akka, timers are modeled as messages, to be delivered to the process that set the timer at a later point in the execution. Rather than waiting for the wall-clock time for each timer to expire, we can deliver it right away, without the application noticing any difference.

Target implementation: akka-raft

The Raft implementation we target is akka-raft. akka-raft is written by one of the core Akka developers, Konrad Malawski. akka-raft is fully featured according to the Raft implementation page; it supports log replication, membership changes, and log compaction. akka-raft has existing unit and integration tests, but it has not yet been deployed in production.

UPDATE: Konrad asked me to include a short note, and I’m glad to oblige:

akka-raft is not an officially supported Akka module, but rather just a side project of Konrad’s. The Akka modules themselves are much more rigorously tested before release.

For our fuzz tests we set up a small 4-node cluster (quorum size=3). akka-raft uses TCP as its default transport protocol, so we configure DEMi to deliver pending messages one-at-a-time in a semi-random order that obeys FIFO order between any pair of processes. We also tell DEMi to inject a given number of client commands (as external messages placed into the pending message buffer), and check the Raft invariants at a fixed interval throughout the execution. We do not yet exercise auxiliary features of akka-raft, such as log compaction or cluster membership changes.

Bug we found

For all of the bugs we found below, we first minimized the faulty execution before debugging the root cause [2]. With the minimized execution in hand, we walked through the sequence of message deliveries in the minimized execution one at a time, noting the current state of the process receiving the message. Based on our knowledge of the way Raft is supposed to work, we found the places in the execution that deviated from our understanding of correct behavior. We then examined the akka-raft code to understand why it deviated, and came up with a fix. We submitted all of our fixes as pull requests.

A few of these root causes had already been pointed out by Jonathan Schuster through a manual audit of the code, but none of them had been verified with tests or fixed before we ran our fuzz tests.

On with the results!

raft-45: Candidates accept duplicate votes from the same election term.

Raft is specified as a state machine with three states: Follower, Candidate, and Leader. Candidates attempt to get themselves elected as leader by soliciting a quorum of votes from their peers in a given election term (epoch).

In one of our early fuzz runs, we found a violation of ‘Leader Safety’, i.e. two processes believed they were leader in the same election term. This is a bad situation for Raft to be in, since the leaders may overwrite each other’s log entries, thereby violating the key linearizability guarantee that Raft is supposed to provide.

The root cause here was that akka-raft’s candidate state did not detect duplicate votes from the same follower in the same election term. (A follower might resend votes because it believed that an earlier vote was dropped by the network). Upon receiving the duplicate vote, the candidate counts it as a new vote and steps up to leader before it actually achieved a quorum of votes.

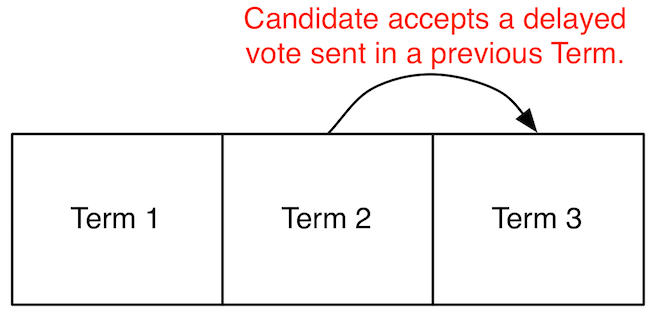
raft-46: Processes neglect to ignore certain votes from previous terms.

After fixing the previous bug, we found another execution where two leaders were elected in the same term.

In Raft, processes attach an ‘election term’ number to all messages they send. Receiving processes are supposed to ignore any messages that contain an election term that is lower than what they believe is the current term.

Delayed Term

akka-raft properly ignored lagging term numbers for some, but not all message types. DEMi delayed the delivery of messages from previous terms and uncovered a case where a candidate incorrectly accepted a vote message from a previous election term.

raft-56: Processes forget who they voted for.

akka-raft is written as an FSM. When making a state transition, FSM processes specify both which state they want to transition to, and which instance variables they want to keep once they have transitioned.

Raft FSM

All of the state transitions for akka-raft were correct except one: when a candidate steps down to follower (e.g., because it receives an AppendEntries message, indicating that there is another leader in the cluster), it forgets which process it previously voted for in that term. Now, when another process requests a vote from it in the same term, it will vote again but this time for a different process than it previously voted for, allowing two leaders to be elected.

raft-58a: Pending client commands delivered before initialization occurs.

After ironing out leader election issues, we started finding other issues. In one of our fuzz runs, we found that a leader process threw an assertion error.

When an akka-raft candidate first makes the state transition to leader, it does not immediately initialize its state (the nextIndex and matchIndex variables). It instead sends a message to itself, and initializes its state when it receives that self-message.

Through fuzz testing, we found that it is possible that the candidate could have pending ClientCommand messages in its mailbox, placed there before the candidate transitioned to leader and sent itself the initialization message. Once in the leader state, the Akka runtime will first deliver the ClientCommand message. Upon processing the ClientCommand message the leader tries to replicate it to the rest of the cluster, and updates its nextIndex hashmap. Next, when the Akka runtime delivers the initialization self-message, it will overwrite the value of nextIndex. When it reads from nextIndex later, it’s possible for it to throw an assertion error because the nextIndex values are inconcistent with the contents of the leader’s log.

raft-58b: Ambiguous log indexing.

In one of our fuzz tests, we found a case where the ‘Log Matching’ invariant was violated, i.e. log entries did not appear in the same order on all machines.

According to the Raft paper, followers should reject AppendEntries requests from leaders that are behind, i.e. prevLogIndex and prevLogTerm for the AppendEntries message are behind what the follower has in its log. The leader should continue decrementing its nextIndex hashmap until the followers stop rejecting its AppendEntries attempts.

This should have happened in akka-raft too, except for one hiccup: akka-raft decided to adopt 0-indexed logs, rather than 1-indexed logs as the paper suggests. This creates a problem: the initial value of prevLogIndex is ambiguous:

  • followers can’t distinguish between an AppendEntries for an empty log (prevLogIndex == 0)
  • an AppendEntries for the leader’s 1st command (prevLogIndex == 0), and
  • an AppendEntries for the leader’s 2nd command (prevLogIndex == 1 - 1 == 0).

The last two cases need to be distinguishable. Otherwise followers won’t be able to reject inconsistent logs. This corner would have been hard to anticipate; at first glance it seems fine to adopt the convention that logs should be 0-indexed instead of 1-indexed.

raft-42: Quorum computed incorrectly.

We also found a fuzz test that ended in a violation of the ‘Leader Completeness’ invariant, i.e. a newly elected leader had a log that was irrecoverably inconsistent with the logs of previous leaders.

Leaders are supposed to commit log entries to their state machine when they knows that a quorum (N/2+1) of the processes in the cluster have that entry replicated in their logs. akka-raft had a bug where it computed the highest replicated log index incorrectly. First it sorted the values of matchIndex (which denote the highest log entry index known to be replicated on each peer). But rather than computing the median (or more specifically, the N/2+1’st) of the sorted entries, it computed the mode of the sorted entries. This caused the leader to commit entries too early, before a quorum actually had that entry replicated. In our fuzz test, message delays allowed another leader to become elected, but it did not have all committed entries in its log due to the previously leader committing too soon.

raft-62: Crash-recovery not yet supported, yet inadvertently triggerable.

Through fuzz testing I found one other case where two leaders became elected in the same term.

The Raft protocol assumes a crash-recovery failure model – that is, it allows for the possibility that crashed nodes will rejoin the cluster (with non-volatile state intact).

The current version of akka-raft does does not write anything to disk (although the akka-raft developers intend to support persistence soon). That’s actually fine – it just means that akka-raft currently assumes a crash-stop failure model, where crashed nodes are never allowed to come back.

The Akka runtime, however, has a default behavior that doesn’t play nicely with akka-raft’s crash-stop failure assumption: it automatically restarts any process that throws an exception. When the process restarts, all its state is reinitialized.

If for any reason, a process throws an exception after it has voted for another candidate, it will later rejoin the cluster, having forgotten who it had voted for (since all state is volatile). Similar to raft-56, this caused two leaders to be elected in our fuzz test.

raft-66: Followers unnecessarily overwrite log entries.

The last issue I found is only possible to trigger if the underlying transport protocol is UDP, since it requires reorderings of messages between the same source, destination pair. The akka-raft developers say they don’t currently support UDP, but it’s on their radar.

The invariant violation here was a violation of the ‘Leader Completeness’ safety property, where a leader is elected that doesn’t have all of the needed log entries.

Lamport Time Diagram

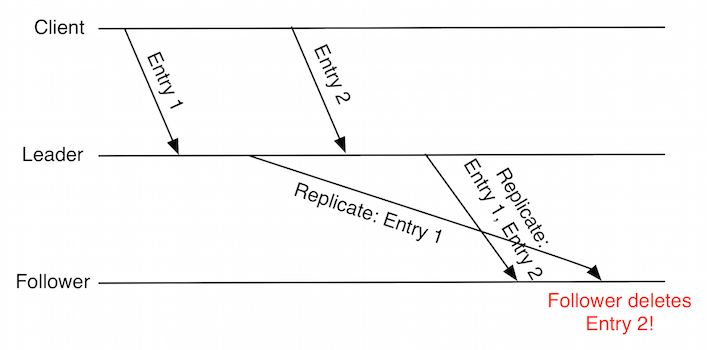
Leaders replicate uncommitted ClientCommands to the rest of the cluster in batches. Suppose a follower with an empty log receives an AppendEntries containing two entries. The follower appends these to its log.

Then the follower subsequently receives an AppendEntries containing only the first of the previous two entries. (This message was delayed, as shown in the Lamport Time Diagram). The follower will inadvertently delete the second entry from its log.

This is not just a performance issue: after receiving an ACK from the follower, the leader is under the impression that the follower has two entries in its log. The leader may have decided to commit both entries if a quorum was achieved. If another leader becomes elected, it will not necessarily have both committed entries in its log as it should.

Conclusion

The wide variety of bugs we found gets me really excited about how useful our fuzzing and minimization tool is turning out to be. The development toolchain for distributed systems is seriously deficient, and I hope that testing techniques like this see more widespread adoption in the future.

I left many details of our approach out of this post for brevity’s sake, particularly a description of my favorite part: how DEMi minimizes the faulty executions it finds to make them easier to understand. Check out our paper draft for more details!

Footnotes

[1] RPC layer interposition does come with a drawback: we’re tied to a particular RPC library. It would be tedious for us to adapt our interposition to the impressive range of systems Jepsen has been applied to.

[2] How we perform this minimization is outside the scope of this blog post. Minimization is, in my opinion, the most interesting part of what we’re doing here. Check out our paper draft for more information!

Distributed systems have two distinguishing features:

  • Asynchrony, or “absence of synchrony”: messages from one process to another do not arrive immediately. In a fully asynchronous system, messages may be delayed for unbounded periods of time. In contrast, synchronous networks always provide bounded message delays.
  • Partial failure: some processes in the system may fail while other processes continue executing.

It’s the combination of these two features that make distributed systems really hard; the crux of many impossibility proofs is that nodes in a fully asynchronous system can’t distinguish message delays from failures.

In practice, networks are somewhere between fully asynchronous and synchronous. That is, most (but not all!) of the time, networks give us sufficiently predictable message delays to allow nodes to coordinate successfully in the face of failures.

When designing a distributed algorithm however, common wisdom says that you should try to make as few assumptions about the network as possible. The motivation for this principle is that minimizing your algorithm’s assumptions about message delays maximizes the likelihood that it will work when placed in a real network (which may, in practice, fail to meet bounds on message delays).

On the other hand, if your network does in fact provide bounds on message delays, you can often design simpler and more performant algorithms on top of it. An example of this observation that I find particularly compelling is Speculative Paxos, which co-designs a consensus algorithm and the underlying network to improve overall performance.

At the risk of making unsubstantiated generalizations, I get the sense that theorists (who have dominated the field of distributed computing until somewhat recently) tend to worry a lot about corner cases that jeopardize correctness properties. That is, it’s the theorist who’s telling us to minimize our assumptions. In contrast, practitioners are often willing to sacrifice correctness in favor of simplicity and performance, as long as the corner cases that cause the system to violate correctness are sufficiently rare.

To resolve the tension between the theorists’ and the practitioners’ principles, my half-baked idea is that we should attempt to answer the following question: “How asynchronous are our networks in practice”?

Before outlining how one might answer this question, I need to provide a bit of background.

Failure Detectors

In reaction to the overly pessimistic asynchrony assumptions made by impossibility proofs, theorists spent about a decade [1] developing distributed algorithms for “partially synchronous” network models. The key property of the partially synchronous model is that at some point in the execution of the distributed system, the network will start to provide bounds on message delays, but the algorithm won’t know when that point occurs.

The problem with the partial asynchrony model is that algorithms built on top of it (and their corresponding correctness proofs) are messy: the timing assumptions of the algorithm are strewn throughout the code, and proving the algorithm correct requires you to pull those timing assumptions through the entire proof until you can finally check at the end whether they match up with the network model.

To make reasoning about asynchrony easier, a theorist named Sam Toueg along with a few others at Cornell proposed the concept of failure detectors. Failure detectors allow algorithms to encapsulate timing assumptions: instead of manually setting timers to detect failures, we design our algorithms to ask an oracle about the presence of failures [2]. To implement the oracle, we still use timers, but now we have all of our timing assumptions collected cleanly in one place.

Failure detectors form a hierarchy. The strongest failure detector has perfect accuracy (it never falsely accuses nodes of failing) and perfect completeness (it always informs all nodes of all failures). Weaker failure detectors might make mistakes, either by falsely accusing nodes of having crashed, or by neglecting to detect some failures. The different failure detectors correspond to different points on the asynchrony spectrum: perfect failure detectors can only be implemented in a fully synchronous network [3], whereas imperfect failure detectors correspond to partial synchrony.

Measuring Asynchrony

One way to get a handle on our question is to measure the behavior of failure detectors in practice. That is, one could implement imperfect failure detectors, place them in networks of different kinds, and measure how often they falsely accuse nodes of failing. If we have ground truth on when nodes actually fail in a controlled experiment, we can quantify how often those corner cases theorists are worried about come up.

Anyone interested in getting their hands dirty?

Footnotes

[1] Starting in 1988 and dwindling after 1996.

[2] Side note: failures detectors aren’t widely used in practice. Instead, most distributed systems use ad-hoc network timeouts strewn throughout the code. At best, distributed systems use adaptive timers, again strewn throughout the code. A library or language that encourages programmers to encapsulate timing assumptions and explicitly handle failure detection information could go a long way towards improving the simplicity, amenability to automated tools, and robustness of distributed systems.

[3] Which is equivalent to saying that they can’t be implemented. Unless you can ensure that the network itself never suffers from any failures or congestion, you can’t guarantee perfect synchrony. Nonetheless, some of the most recent network designs get us pretty close.

A typical web page is composed of multiple objects: HTML files, Javascript files, CSS files, images, etc..

When your browser loads a web page, it executes a list of tasks: first it needs to fetch the main HTML, then it can parse each of the HTML tags to know what other objects to fetch, then it can process each of the fetched objects and their effect on the DOM, and finally it can render pixels to your screen.

To load your web page as fast as possible, the browser tries to execute as many of these tasks as it can in parallel. The less time the browser spends sitting idle waiting for tasks to finish, the faster the web page will load.

It is not always possible to execute tasks in parallel. This is because some tasks have dependencies on others. The most obvious example is that the browser needs to fetch the main HTML before it can know what other objects to fetch [1].

In general, the more dependencies a web page has, the longer it will take to load. Prudent web developers structure their web pages in a way that minimizes browsers’ task dependencies.

A particularly nasty dependency is Javascript execution. Whenever the browser encounters a Javascript tag, it stops all other parsing and rendering tasks, waits to fetch the Javascript, executes it until completion, and finally restarts the previously blocked tasks. Browsers enforce this dependency because Javascript can modify the DOM; by modifying the DOM, Javascript might affect the execution of all other parsing and rendering tasks.

Placing Javascript tags in the beginning of an HTML page can have a huge performance hit, since each script adds 1 RTT plus computation time to the overall page load time.

Fortunately, the HTML standard provides a mechanism that allows developers to mitigate this cost: the defer attribute. The defer attribute tells the browser that it’s OK to fetch and execute a Javascript tag asynchronously.

Unfortunately, using the defer tag is not straightforward. The issue is that it’s hard for the web developer to know whether it’s safe to allow the browser to execute Javascript asynchronously. For instance, the Javascript may actually need to modify the DOM to ensure the correct execution of the page, or it may depend on other resources (e.g. other Javascript tags).

Forcing web developers to reason about these complicated (and often hidden!) dependencies is, at best, a lot to ask for, and at worst, highly error-prone. For this reason few web developers today make use of defer tags.

So here’s my half-baked idea: wouldn’t it be great if we had a compiler that could automatically mark defer attributes? Specifically, let’s apply static or dynamic analysis to infer when it’s safe for Javascript tags to execute asynchronously. Such a tool could go a long way towards improving the performance and correctness of the web.

Footnotes

[1] See the WProf paper for a nice overview of browser activity dependencies.

gdb, although an incredibly powerful tool for debugging single programs, doesn’t work so well for distributed systems.

The crucial difference between a single program and a distributed system is that distributed computation revolves around network messages. Distributed systems spend much of their time doing nothing more than waiting for network messages. When they receive a message, they perform computation, perhaps send out a few network messages of their own, and then return to their default state of waiting for more network messages.

Because there’s a network separating the nodes of the distributed system, you can’t (easily) pause all processes and attach gdb. And, in the words of Armon Dadgar, “even if you could, the network is part of your system. Definitely not going to be able to gdb attach to that.”

Suppose that you decide to attach gdb to a single process in the distributed system. Even then, you’ll probably end up frustrated. You’re going to spend most of your time waiting on a select or receive breakpoint. And when your breakpoint is triggered, you’ll find that most of the messages won’t be relevant for triggering your bug. You need to wait for a specific message, or even a specific sequence of messages, before you’ll be able to trace through the code path that leads to your bug.

Crucially, gdb doesn’t give you the ability to control network messages, yet network message are what drive the distributed system’s execution. In other words, gdb operates at a level of abstraction that is lower than what you want.

Distributed systems need a different kind of debugger. What we need is a debugger that will allow us to step through the distributed system’s execution at the level of network messages. That is, you should be able to generate messages, control the order in which they arrive, and observe how the distributed system reacts.

Shameless self-promotion: STS supports an “Interactive Mode” that takes over control of the (software) network separating the nodes of a distributed system. This allows you to interactively reorder or drop messages, inject failures, or check invariants. We need something like this for testing and debugging general distributed systems.

As a graduate student, I find that the rate of progress I’m able to make on my current research project is significantly lower than the rate at which I encounter ideas for new research projects. Over time, this means that the number of half-baked ideas jotted down in my notebook grows without bound.

In Academia, we sometimes feel dissuaded from sharing our half-baked ideas. Our fear is that we may get ‘scooped’; that is, we worry that if we share an idea before we have a time to flesh it out, someone else may take that idea and turn it into a fully-fledged publication, thereby stealing our opportunity to publish.

Until now, I haven’t publicly shared any of my half-baked ideas. I would like to change that [1].

So, in the hope of generating discussion, I’ll be posting a series of half-baked ideas. Please feel welcome to steal them, criticize them, or add to them!


[1] In part, this is because I have come to believe that academic caginess is petty. More importantly though, I have come to the terms with the reality that I will not have time to pursue most of these ideas.

At Berkeley I have the opportunity to work with some of the smartest undergrads around. One of the undergrads I work with, Andrew Or, did some neat work on modeling the performance of network control plane systems (e.g. SDN controllers). He decided to take a once-in-a-lifetime opportunity to join Databricks before we got the chance to publish his work, so in his stead I thought I’d share his work here.

An interactive version of his performance model can be found at this website. Description from the website:

A key latency metric for network control plane systems is convergence time: the duration between when a change occurs in a network and when the network has converged to an updated configuration that accommodates that change. The faster the convergence time, the better.


Convergence time depends on many variables: latencies between network devices, the number of network devices, the complexity of the replication mechanism used (if any) between controllers, storage latencies, etc. With so many variables it can be difficult to build an intuition for how the variables interact to determine overall convergence time.


The purpose of this tool is to help build that intuition. Based on analytic models of communication complexity for various replication and network update schemes, the tool quantifies convergence times for a given topology and workload. With it, you can answer questions such as "How far will my current approach scale while staying within my SLA?", and "What is the convergence time of my network under a worst-case workload?".

The tool is insightful (e.g. note the striking difference between SDN controllers and traditional routing protocols) and a lot of fun to play around with; I encourage you to check it out. In case you are curious about the details of the model or would like to suggest improvements, the code is available here. We also have a 6-page write up of the work, available upon request.

I often overhear a recurring debate amongst researchers: is Academia a good place to build real software systems? By “real”, we typically mean “used”, particularly by people outside of academic circles.

There have certainly been some success stories. BSD, LLVM, Xen, and Spark come to mind.

Nonetheless, some argue that these success stories came about at a time when the surrounding software ecosystem was nascent enough for a small group of researchers to be able to make a substantial contribution, and that the ecosystem is normally at a point where researchers cannot easily contribute. Consider for example that BSD was initially released in 1977, when very few open source operating systems existed. Now we have Linux, which has almost 1400 active developers.

Is this line of reasoning correct? Is the heyday of Academic systems software over? Will it ever come again?

Without a doubt, building real software systems requires substantial (wo)manpower; no matter how great the idea is, implementing it will require raw effort.

This fact suggests an indirect way to evaluate our question. Let’s assume that (i) any given software developer can only produce a fixed (constant) amount of coding progress in a fixed timeframe and (ii) the maturity of the surrounding software ecosystem is proportional to collective effort put into it. We can then approximate an answer to our question by looking at the number of software developers in industry vs. the number of researchers over time.

It turns out that the Bureau of Labor Statistics publishes exactly the data we need for the United States. Here’s what I found:

OES data

Hm. The first thing we notice is that it’s hard to even see the line for academic and industrial researchers. To give you a sense of where it’s at, the y-coordinate at May, 2013 for computer science teachers and professors is 35,770, two orders of magnitude smaller than the 3,339,440 total employees in the software industry at that time.

What we really care about though is the ratio of employees in industry to number of researchers:

OES ratio data

In the last few years, both the software industry and Academia are growing at roughly the same rate, whereas researchers in industrial labs appear to be dropping off relative to the software industry. We can see this relative growth rate better by normalizing the datasets (dividing each datapoint by the maximum datapoint in its series – might be better to take the derivative, but I’m too lazy to figure out how to do that at the moment):

OES normalized data

The data for the previous graphs only goes back to 1995. The Bureau of Labor Statistics also publishes coarser granularity going all the way to 1950 and beyond:

NES data

(See the hump around 2001?)

Not sure if this data actually answers our initial question, but I certainly found it insightful! If you’d like more details on how I did this analysis, or would like to play around with the data for yourself, see my code.