Last month, Crista Lopes asked the twitterverse:
Twitter friends: what papers or frameworks do you recommend regarding distributed systems regression or integration testing techniques?
— Crista Lopes (@cristalopes) January 22, 2016
She compiled the answers she received in a blog post, which ended on a dispirited note:
In spite of unit testing being a standard practice everywhere, things don’t seem to have gotten any better for testing distributed systems end-to-end.
From my viewpoint atop the ivory tower, the state-of-the-art in testing distributed systems doesn’t seem quite as disappointing as Crista’s blog post might lead you to believe. As I am now wrapping up my dissertation on testing and debugging distributed systems, I feel compelled to share some of what I’ve learned about testing over the last five years.
Crista points out that there are several existing surveys of testing techniques for distributed systems, e.g. Inés Sombra’s RICON 2014 talk or Caitie McCaffrey’s CACM article. Here, I’ll structure the discussion around the challenges posed by different testing goals, and the tradeoffs different testing technologies make in overcoming those challenges. I’ll mostly cover end-to-end techniques (per Crista’s original question), and I’ll focus on academic research rather than best practices.
Here we go!
Regression Testing for Correctness Bugs
Crista’s original question is about regression testing, so I’ll start there. The regression testing problem for correctness bugs is the following:
- We’re given: (i) a safety condition (assertion) that the system has violated in the past, and (ii) the environmental conditions (e.g. system configuration) that caused the system to violate the safety condition.
- Our goal: we want to produce an oracle (automated test case) that will notify us whenever the old bug resurfaces as we make new changes to the codebase.
What’s hard about producing these oracles for distributed systems? A few challenges:
- a) Non-determinism: we’d like our regression test to reliably reproduce the bug whenever it resurfaces. Yet distributed systems depend on two major sources of non-determinism: the order of messages delivered by the network, and clocks (e.g., failure detectors need timeouts to know when to send heartbeat messages1).
- b) Timeliness: we’d like our regression test to complete within a reasonable amount of time. Yet if we implement it naïvely, the regression test will have to sleep() for a long time to ensure that all events have completed.
One way to overcome both a) and b) is to interpose on message and timer APIs. The basic idea here is to first record the behavior of the non-deterministic components of the system (e.g., track the order of messages delivered by the network) leading up to the original bug. Then, when we execute the regression test, we guide the behavior of those non-deterministic components to stay as close as possible to the original recorded execution.2
Interposition helps us produce reliable results, and it allows us to know exactly when the test has completed so that we don’t need to sleep() for arbitrary amounts of time. In some cases we can even run our regression tests significantly faster than they would actually take in production, by delivering timer events before the true wall-clock time for those timers has elapsed (without the system being aware of this fact).3
However, interposition brings two additional challenges:
- c) Engineering effort: depending on where we choose to interpose, we might need to expend large amounts of effort to ensure that our executions are sufficiently deterministic.
- d) Limited shelf-life: if we record interposition events at fine granularity, the regression test is likely to break as soon as we make small changes to the system (since the API calls invoked by the system will differ). Ideally we would like our regression tests to remain valid even as we make substantial changes to the system under test.
Solutions
On one extreme, we could use deterministic replay tools to reliably execute our regression test. These tools interpose on syscalls, signals, and certain non-deterministic instructions.4 If your distributed system has a small enough memory footprint, you can just execute deterministic replay with all of your nodes on a single physical machine.5,6 There are also approaches for replaying across multiple machines.7,8
Deterministic replay assumes that you are able to record an execution that leads up to the bug. To replay that execution, these tools wait for the application to make the same sequence of syscalls as the original execution, and return the same syscall values that were originally returned by the OS. Since the application must go through the syscall layer to interact with the outside world (including, for example, to read the current time), we are guaranteed determinism. That said, one major issue with using deterministic replay for regression testing is that the execution recording has limited shelf-life (since syscall recordings are very fine-grained).
Another issue with deterministic replay is that you don’t always have a recorded execution for bugs that you know exist. If you’re willing to wait long enough, it is possible to synthesize an interleaving of messages / threads that leads up to the known bug.9,10,11,12,13
Another point in the design space is application-specific interposition, where we interpose on a narrow, high level API such as the RPC layer. We aren’t guaranteed determinism here, but we can achieve decent reliability with a judicious choice of interposition locations.
One major advantage of application-specific interposition is reduced recording overhead: since we’re interposing on a high level API, we might be able to turn on execution recording in production to avoid needing to reproduce bugs in a test environment. Another advantage is extended shelf-life: we’re interposing on coarse, high level events, and we also have access to application semantics that help us recognize extraneous changes to the application’s behavior (e.g., we can know that cookies or sequence numbers should be ignored when deciding whether a message from the recorded execution is logically equivalent to a message in a replay execution).
[Shameless plug for my own work, which fits into the category of application-specific interposition: our DEMi tool14 allows you to produce regression tests without having to write any code. First, you use it find correctness bugs through randomized concurrency testing. You can then minimize the buggy execution, and finally you can replay the execution as a regression test. DEMi interposes on timers to make the execution super fast, and allows you to specify message fields that should be ignored to help increase the shelf-life of the recording.]
Finally, on the other extreme of the design space, we can just replay multiple times without any interposition and hope that the bug-triggering event interleaving shows up at least once.15 This requires minimal engineering effort and has unbounded shelf-life, but it may be unable to consistently reproduce the buggy execution.
Regression Testing for Performance (Latency) Bugs
The regression testing problem for latency bugs is similar to above, with a few differences:
- We’re given: (i) an assertion that we know the system has violated in the past, usually statistical in nature, about how long requests should take to be processed by the system, and (ii) a description of the system’s workload at the time the latency problem was detected.
- Our goal: we want to produce an oracle that will notify us whenever request latency gets notably worse as we make new changes to the system.
A few challenges:
- a) Flakiness: Performance characteristics typically exhibit large variance. Despite variance, we need our assertion to avoid reporting too many false positives. Conversely, we need to prevent the assertion from missing too many true positives.
- b) Workload characterization: it can be difficult to reproduce production traffic mixes in a test environment.
Regardless of whether your system is distributed or located on a single machine, request latency is defined by the time it takes to execute the program’s control flow for that request. In a system where concurrent tasks process a single request, it is useful to consider the critical path: the longest chain of dependent tasks starting with the request’s arrival, and ending with completion of the control flow.
The challenges with observing control flow for distributed systems are the following:
- c) Limited Visibility: the control flow for a single request can touch thousands of machines, any one of which might be the source of a latency problem.16 So, we need to aggregate timing information across machines. Simple aggregation of statistics often isn’t sufficient though, since a single machine doesn’t have a way of knowing which local tasks were triggered by which incoming request.
- d) Instrumentation Overhead: It’s possible that the act of measuring execution times can itself significantly perturb the execution time, leading to false positives or false negatives.
- e) Intrusiveness: if we’re using our production deployment to find performance problems, we need to avoid increasing latency too much for clients.
Solutions
The main technique for addressing these challenges is distributed tracing. The core idea is simple:17 have the first machine assign an ID to the incoming request, and attach that ID (plus a pointer to the parent task) to all messages that are generated in response to the incoming request. Then have each downstream task that is involved in processing those messages log timing information associated with the request ID to disk.
Propagating the ID across all machines results in a tree of timing information, where each vertex contains timing information for a single task (the ingress being the root), and each edge represents a control flow dependency between tasks. This timing information can be retrieved asynchronously from each machine. To minimize instrumentation overhead and intrusiveness, we can sample: only attach an ID to a fraction of incoming requests. As long as overhead is low enough, we could overcome the challenge of workload characterization by running causal tracing on our production deployment.
Here is an illustration18:
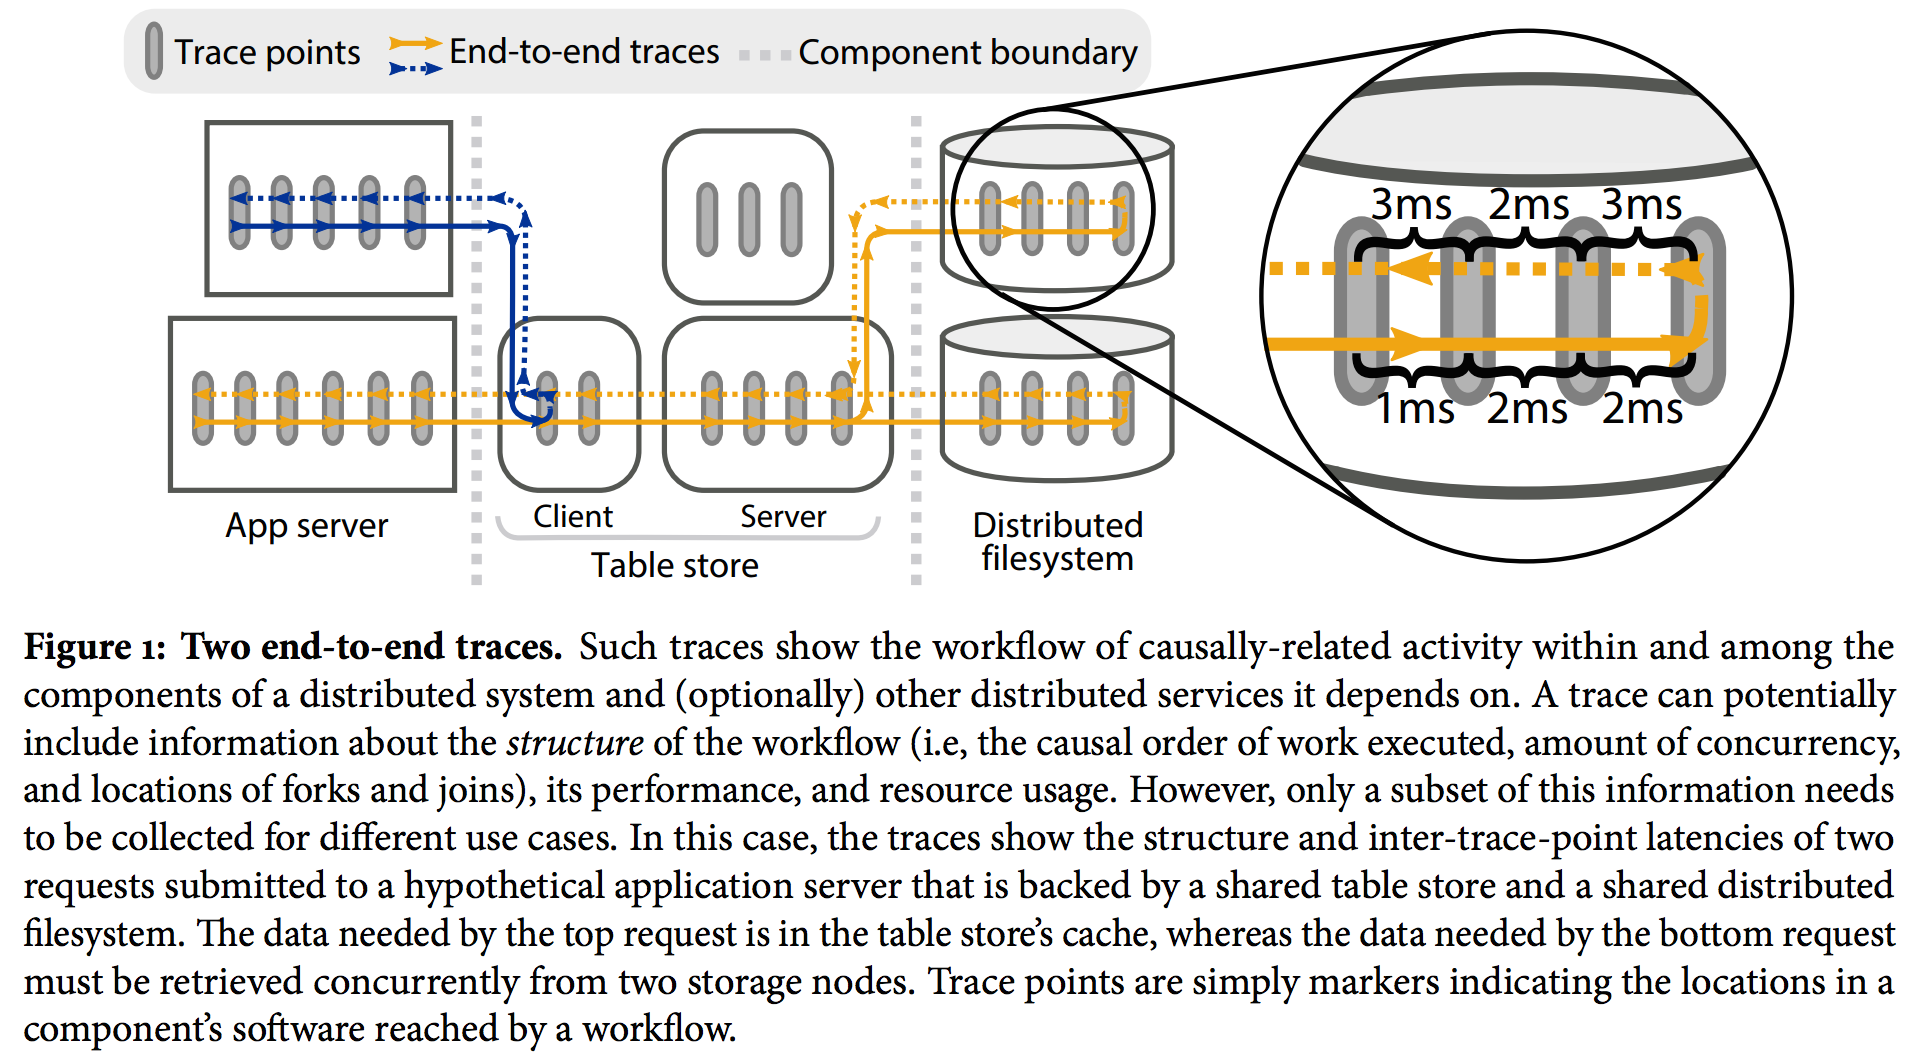
What can we do with causal trees? A bunch of cool stuff: characterize the production workload so that we can reproduce it in a test environment,19 resource accounting20 and ‘what-if’ predictions for resource planning,21 track flows across administrative domains,22 visualize traces and express expectations about how flows should or should not be structured,23 monitor performance isolation in a multi-tenant environment,24 and most relevant for performance regression testing: detecting and diagnosing performance anomalies.25
Distributed tracing does require a fair amount of engineering effort: we need to modify our system to attach and propagate IDs (it’s unfortunately non-trivial to ‘bolt-on’ a tracing system like Zipkin). Perhaps the simplest form of performance regression testing we can do is to analyze performance statistics without correlating across machines. We can still get end-to-end latency numbers by instrumenting clients, or by ensuring that the machine processing the incoming request is the same as the machine sending an acknowledgment to the client. The key issue then is figuring out the source of latency once we have detected a problem.
Discovering Problems in Production
Despite our best efforts, bugs invariably make it into production.26 Still, we’d prefer to discover and diagnose these issues through means that are more proactive than user complaints. What are the challenges of detecting problems in production?:
- a) Runtime overhead: It’s crucial that our instrumentation doesn’t incur noticeable latency costs for users.
- b) Possible privacy concerns: In some cases, our monitoring data will contain sensitive user information.
- c) Limited visibility: We can’t just stop the world to collect our monitoring data, and no single machine has global visibility into the state of the overall system.
- d) Failures in the monitoring system: The monitoring system is itself a distributed system that needs to deal with faults gracefully.
Solutions
An old idea is particularly useful here: distributed snapshots.27 Distributed snapshots are defined by consistent cuts: a subset of the events in the system’s execution such if any event e is contained in the subset, all ‘happens-before’ predecessors of e are also contained in the subset.
Distributed snapshots allow us to obtain a global view of the state of all machines in the system, without needing to stop the world. Once we have a distributed snapshot in hand, we can check assertions about the state of the overall system (either offline28 or online29).
Since runtime overheads limit how much information we can record in production, it can be challenging to diagnose a problem once we have detected it. Probabilistic diagnosis techniques30,31,32 seek to capture carefully selected diagnostic information (e.g. stack traces, thread & message interleavings) that should have high probability of helping us find the root cause of a problem. One key insight underlying these techniques is cooperative debugging: the realization that even if we don’t collect enough diagnostic information from a single bug report, it’s quite likely that the bug will happen more than once.33
Identifying which pieces of hardware in your system have failed (or are exhibiting flaky behavior) is a non-trivial task when you only have a partial view into the state of the overall system. Root cause analysis techniques (a frustratingly generic name IMHO..) seek to infer unknown failure events from limited monitoring data.34,35
That’s It For Now; More to Come!
I should probably get back to writing my dissertation. But stay tuned for future posts, where I hope to cover topics such as:
- Fault tolerance testing
- Test case reduction
- Distributed debugging
- Tools to help you write correctness conditions
- Tools to help you better comprehend diagnostic information
- Dynamic analysis for finding race conditions & atomicity violations
- Model checking & symbolic execution
- Configuration testing
- Verification
- Liveness issues
- …
If you’d like to add anything I missed or correct topics I’ve mischaracterized, please feel free to issue a pull request!
-
“Heartbeat: A Timeout-Free Failure Detector for Quiescent Reliable Communication.” International Workshop on Distributed Algorithms ‘97 ↩
-
The test framework can’t modify the messages sent by the system, but it can control other sources of non-determinism, e.g. the order in which messages are delivered. ↩
-
“To Infinity and Beyond: Time-Warped Network Emulation”, NSDI ‘06 ↩
-
“Hardware and software approaches for deterministic multi-processor replay of concurrent programs”, Intel Technology Journal ‘09 ↩
-
“ReVirt: Enabling Intrusion Analysis Through Virtual-Machine Logging and Replay”, OSDI ‘02 ↩
-
“Deterministic Process Groups in dOS, OSDI ‘10”. [Technically deterministic execution, not deterministic replay] ↩
-
“Replay Debugging For Distributed Applications”, ATC ‘06 ↩
-
“DDOS: Taming nondeterminism in distributed systems”, ASPLOS ‘13. ↩
-
“Execution Synthesis: A Technique For Automated Software Debugging”, EuroSys ‘10 ↩
-
“PRES: Probabilistic Replay with Execution Sketching on Multiprocessors”, SOSP ‘09 ↩
-
“ODR: Output-Deterministic Replay for Multicore Debugging”, SOSP ‘09 ↩
-
“Analyzing Multicore Dumps to Facilitate Concurrency Bug Reproduction”, ASPLOS ‘10 ↩
-
“Debug Determinism: The Sweet Spot for Replay-Based Debugging”, HotOS ‘11 ↩
-
“Minimizing Faulty Executions of Distributed Systems”, NSDI ‘16 ↩
-
“Testing a Database for Race Conditions with QuickCheck”, Erlang ‘11 ↩
-
We might not need to aggregrate statistics from all the machines, but at the very least we need timings from the first machine to process the request and the last machine to process the request. ↩
-
“Path-based failure and evolution management”, SOSP ‘04 ↩
-
“So, you want to trace your distributed system? Key design insights from years of practical experience”, CMU Tech Report ↩
-
“Using Magpie for request extraction and workload modelling”, SOSP ‘04 ↩
-
“Stardust: tracking activity in a distributed storage system”, SIGMETRICS ‘06 ↩
-
“Ironmodel: robust performance models in the wild”, SIGMETRICS ‘08 ↩
-
“X-trace: a pervasive network tracing framework”, NSDI ‘07 ↩
-
“Pip: Detecting the Unexpected in Distributed Systems”, NSDI ‘06 ↩
-
“Retro: Targeted Resource Management in Multi-tenant Distributed Systems”, NSDI ‘15 ↩
-
“Diagnosing performance changes by comparing request flows”, NSDI ‘11 ↩
-
‘Hark’, you say! ‘Verification will make bugs a thing of the past!’ –I’m not entirely convinced… ↩
-
Distributed Snapshots: Determining Global States of Distributed Systems, ACM TOCS ‘85 ↩
-
WiDS Checker: Combating Bugs in Distributed Systems, NSDI ‘07 ↩
-
D3S: Debugging Deployed Distributed Systems, NSDI ‘08 ↩
-
SherLog: Error Diagnosis by Connecting Clues from Run-time Logs, ASPLOS ‘10 ↩
-
Effective Fault Localization Techniques for Concurrent Software, PhD Thesis ↩
-
Failure Sketching: A Technique for Automated Root Cause Diagnosis of In-Production Failures, SOSP ‘15 ↩
-
Cooperative Bug Isolation, PhD Thesis ↩
-
A Survey of Fault Localization Techniques in Computer Networks, SCP ‘05 ↩
-
Detailed Diagnosis in Enterprise Networks, SIGCOMM ‘09 ↩